This page can be edited to provide information or a user interface for the project.
The Andorville™ Monte Carlo software is used to design, run and analyse Monte Carlo simulations.
Monte Carlo simulations show how the uncertainty in input measurements affect the uncertainty in calculated values based on those measurements.
Measurement uncertainty is defined using probability distributions.
Calculated value uncertainty is displayed using cumulative probability charts and probability density histograms generated from the simulation output data.
With large uncertainties, decisions should be made using the estimated probability distribution rather than single values calculated deterministically from single input measurements or averages.
The source code and setup files for this application can be downloaded from this GitHub page: ADVL_Monte Carlo
These pages provide more information on Monte Carlo simulation: An Introduction to Monte Carlo Simulation
The Main form contains the following tabs:
Workflow - The default workflow page contains a description of the application. Workflow pages are coded in HTML and can be edited by the user.
Summary - A summary of the selected Monte Carlo project including the name and description. The simulation steps can be run from this page.
Random Variables - Definitions of the Random Variables used in the Monte Carlo model.
Correlations - A Correlation Matrix is used to specify the correlation coefficients of the Random Variables in the model.
Correlations affect the probability distribution of calculated values and should be included in the simulation model.
Calculations - A Calculation Tree is used to read input values from the table, calculate output values and write these to the table.
Data Table - The Data Table tab displays Random Variable values and calculated values in a table.
Table Operations - This tab contains options to modify the data in a table.
Project Information - Information about the selected Andorville™ Monte Carlo project.
The Andorville™ Monte Carlo Workflow tab displays information about the application.
This page can be edited to provide information or a user interface for the project.
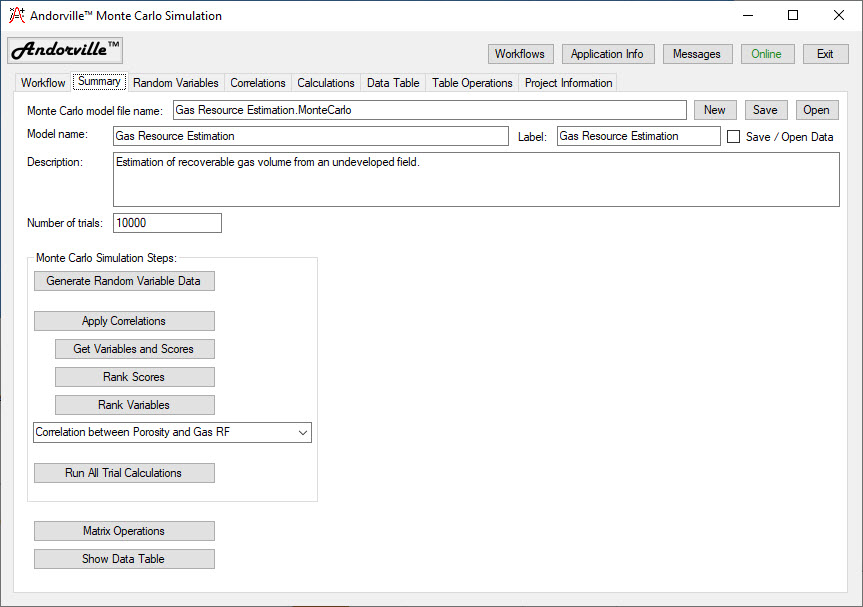
The Andorville™ Monte Carlo Summary tab displays a summary of the selected model including the file name, model name, description and number of trials to use in the simulation.
New models can be created, saved or existing models opened from this page.
The simulation steps can be run from this page:
Generate Random Variable Data - Pressing this button generates a set of random variable values for each of the trials in the simulation.
The data is written to the Calculations table.
Apply Correlations - If a Correlation Matrix has been defined, the random variable data has the specified correlation coefficients applied.
This is done by re-ordering the set of values for each random variable.
The correlation steps can also be applied separately:
Get Variables and Scores - Get the sorted random variable columns and corresponding random scores columns in the temporary CorrCalcs table.
This is the first step in the Iman-Conover method of correlating the random variable data.
Rank Scores - The Iman-Conover matrix operations are applied to the random scores to produce a set of ranked score columns with the required correlation coefficients.
Rank Variables - The sorted random variable columns are rearranged into the same order (or rank) as the corresponding ranked score columns.
The random variable columns now have approximately the required correlation coefficients.
Run All Trial Calculations - Calculate output values using the random variable data for each trial. The calculated values are written to the Calculations table.
The Matrix Operations button opens a form used to perform a variety of matrix calculations. The Matrix Operations Sequence tab is used to construct a matrix calculation tree.
This can be used to display the calculations used in the Iman-Conover method of correlating random variables.
The Show Data Table button opens a new form displaying the generated random variable data and the calculated values.
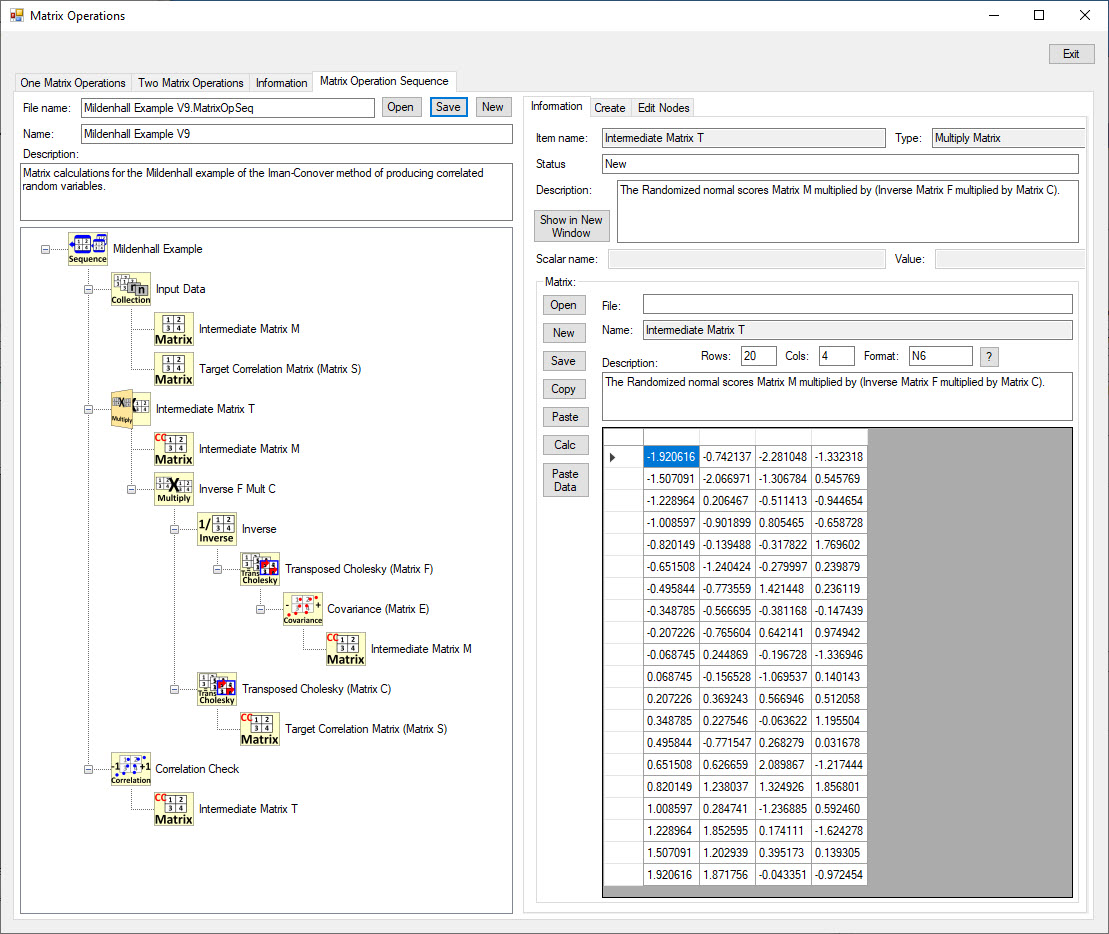
The Matrix Operations form is used to perform a variety of matrix calculations.
This form is not used in Monte Carlo simulations but was added to investigate the matrix operations used in the Iman-Conover method of correlating random variables.
The matrix operation sequence used by the Iman-Conover method is displayed below.
The inputs to the process are the desired correlation matrix (Matrix S) and the randomised "score" matrix (Matrix M) based on the inverse normal cumulative distribution function with a mean of 0 and standard deviation of 1.
The calculation tree shows the matrix operations applied to the two input matrices to generate the Intermediate Matrix T, which has the desired correlations.
Each random variable data column is re-ordered to match the order in the corresponding column in Matrix T.
After re-ordering, the random variable data have approximately the desired correlations.
The re-ordering does not affect the probability distribution of each random variable.
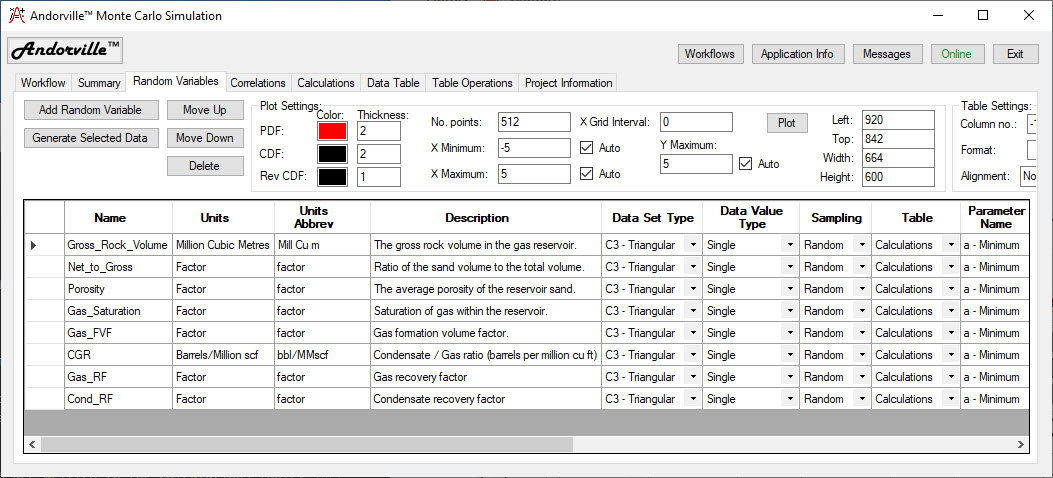
The random variables used in the simulation are defined on the Random Variables tab.
Random variable parameters define the probability distribution of the values of an input variable used in the simulation.
The left side of the data entry table is shown below.
The following parameters are entered for each random variable:
Name - The name of the variable.
Units - The measurement units.
Units Abbrev - An abbreviation of the measurement units. This is used to show the units on charts.
Description - A description of the random variable.
Data Set Type - The type of continuous or discrete distribution is selected from a list. Special data sets can also be selected including the trial number and imported data.
Data Value Type - The type of data values used to store the random variable data - Single, Double or Integer.
Sampling - The type of sampling used to generate the random variable data - Random, Latin Hypercube or Median Latin Hypercube.
Table - The name of the data table used to store the random variable data. This is usually the Calculations table.
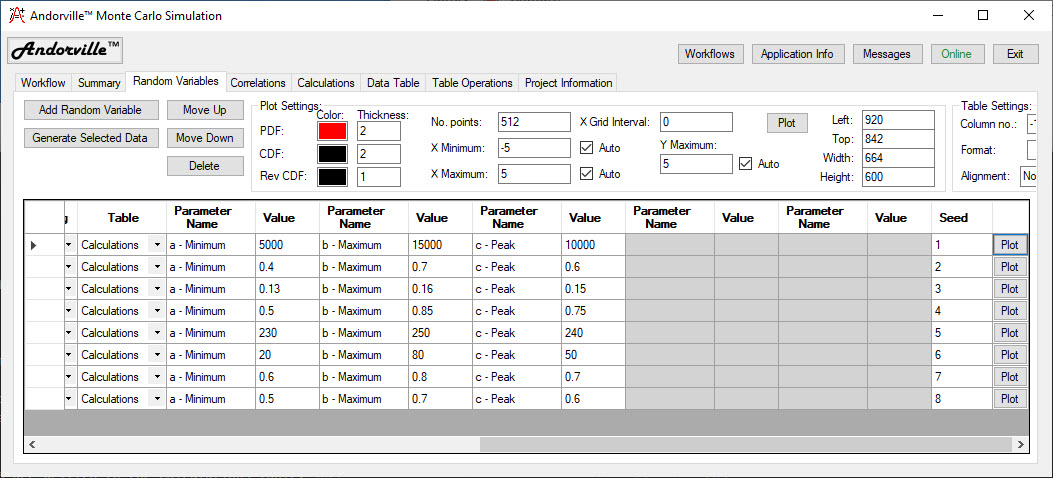
The right side of the data entry table is shown below.
Up to five random variable parameters are entered in the table, depending on the type of distribution selected.
The Triangular distributions have three parameters - Minimum value, Maximum value and Peak value.
Pressing the Plot buttons, to the right of the table or in the Plot Settings box near the top of the page, displays a plot of the selected probability distribution.
If a repeatable set of random variable values is required, an integer of value one or larger is entered in the seed column.
Each random variable should have a different seed value.
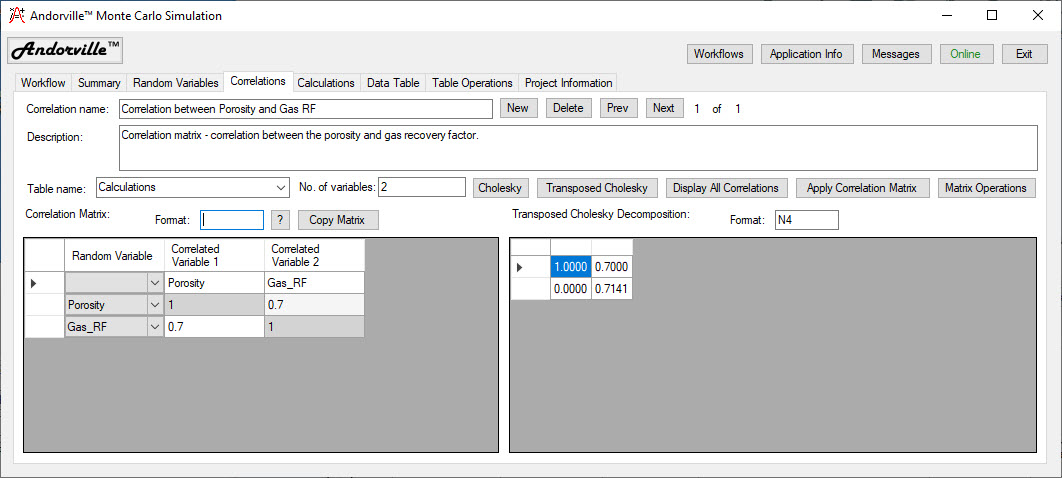
The Correlations tab is used to specify correlations between random variables using a correlation matrix.
The number of correlated variables is specified and the correlation coefficient between each pair of random variables is entered in the matrix.
If a Cholesky decomposition of the correlation matrix can be generated then the matrix is consistent.
The Calculations tab is used to define a calculation tree consisting of nodes to read data from the table, perform arithmetic operations and write calculated values to the table.
The Create page contains a selection of node types that can be added to the tree to perform the calculations.
The node Name, Description, Units and Units Abbreviation are entered for a new node.
Some node types require additional parameters.
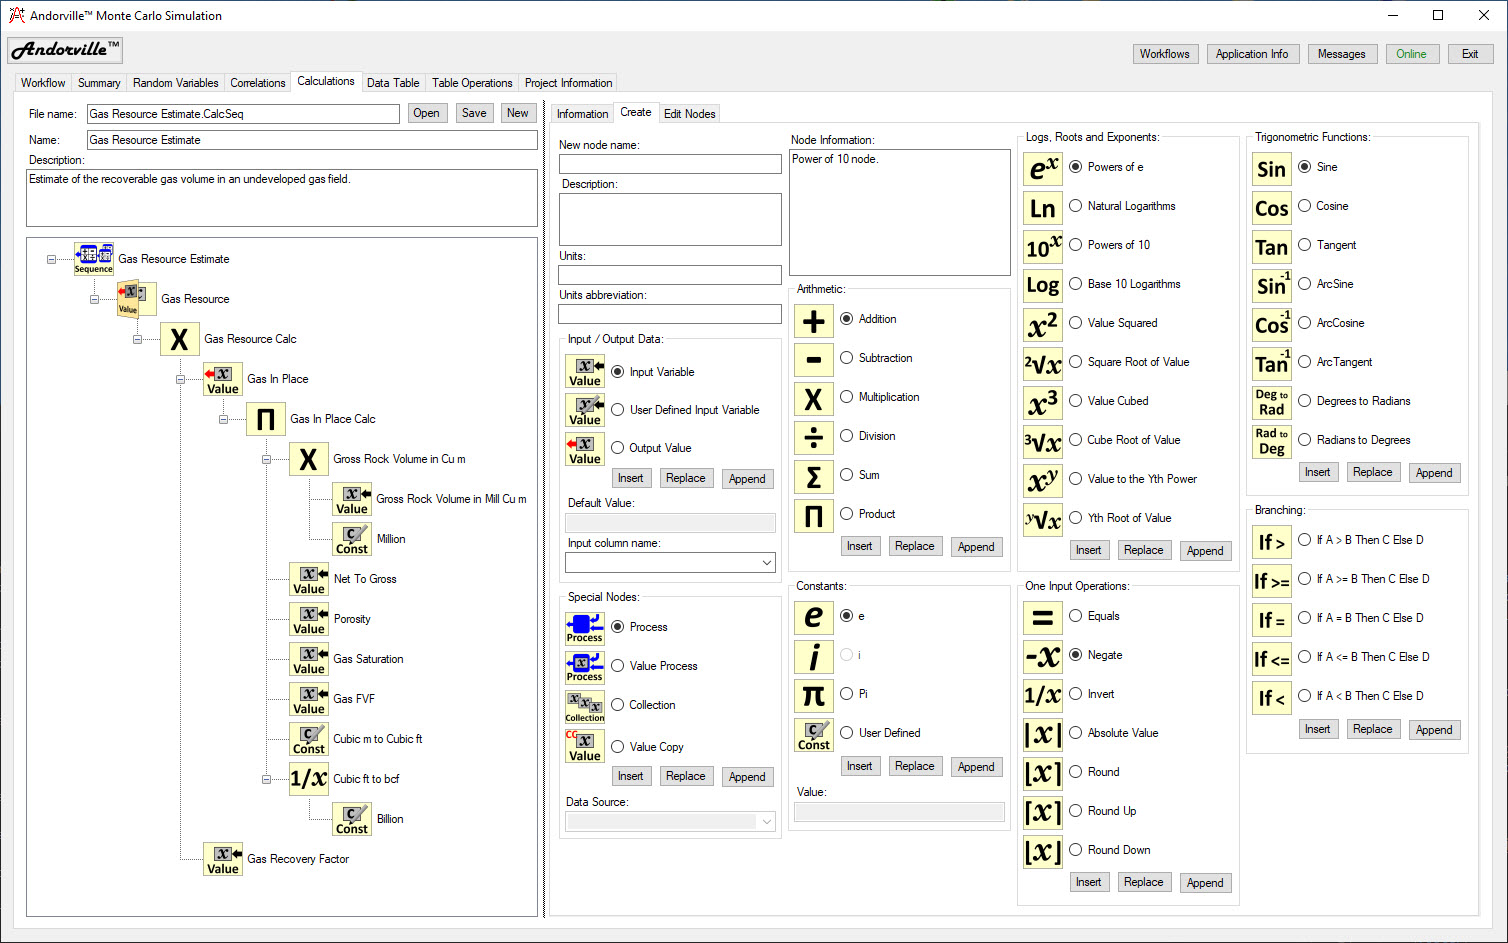
Calculation nodes can be edited on the Edit Nodes page.
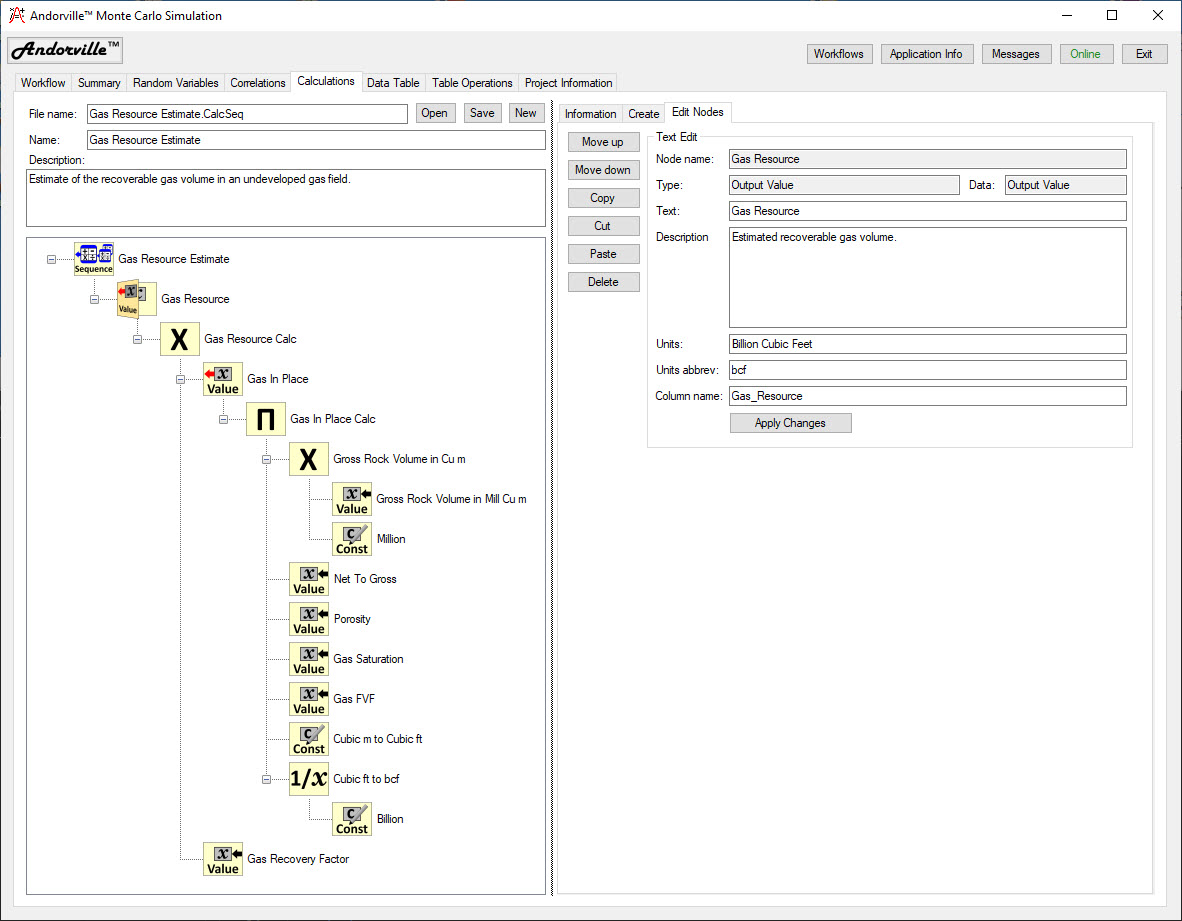
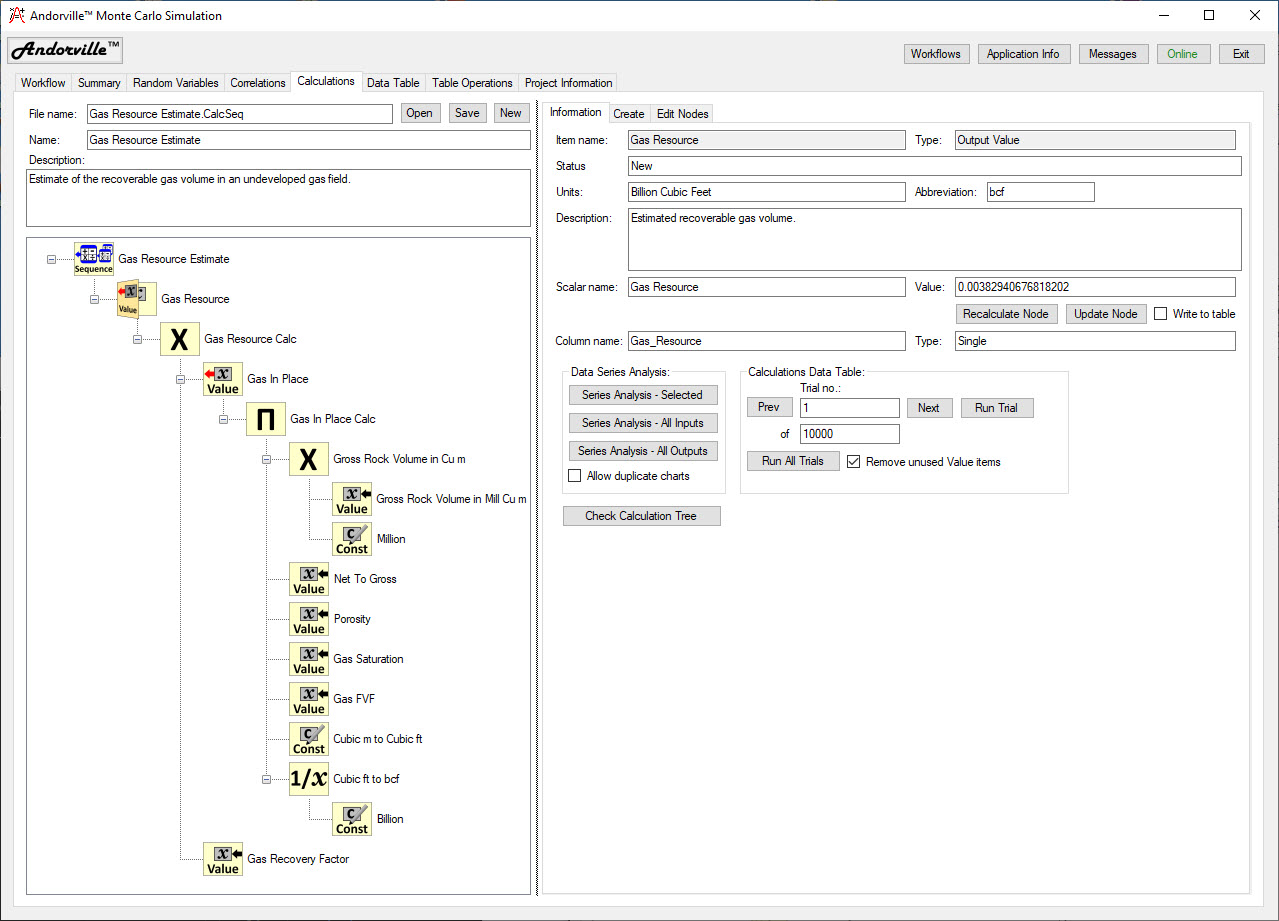
The Information page displays information about the selected node.
Pressing the Series Analysis generates a chart of the probability distribution of the data corresponding to the selected node.
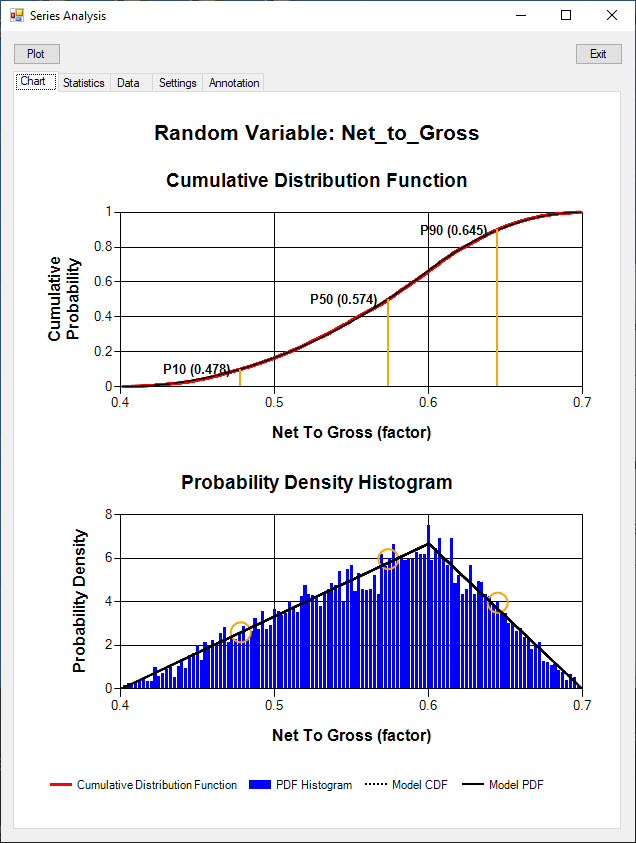
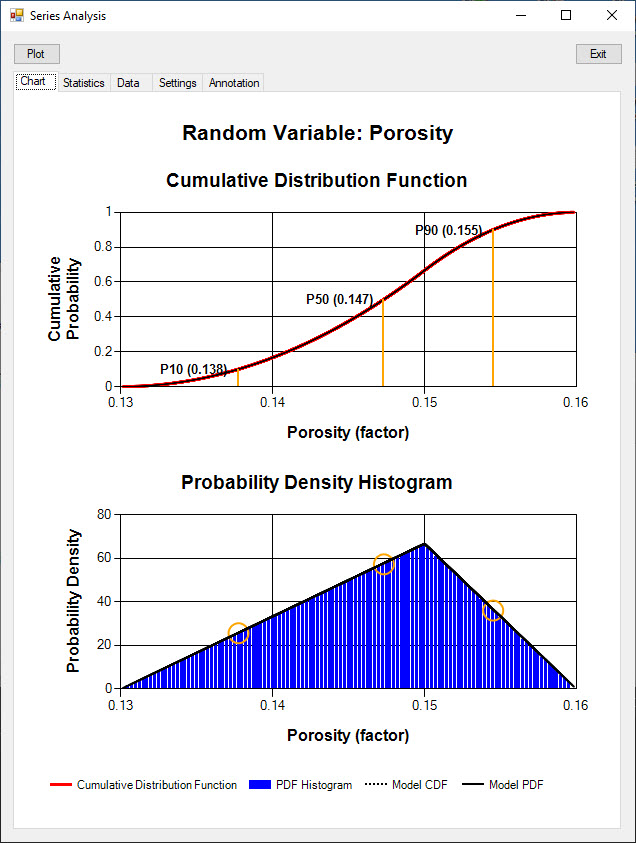
Series analysis forms display the probability distributions of input random variables and calculated output values.
Two series analysis forms are shown below.
Random variable data generated using random sampling is analysed on the left. On the right the data was generated using latin hypercube sampling.
The Cumulative Distribution Function (red line) shows the probability that the series value is less than or equal to the value on the X Axis.
The cumulative probability on the Y Axis ranges from 0 to 1.
Particular probability values can be annotated on the chart.
A P90 value of 0.645 means that the value of the random variable has 90% chance of being less than or equal to 0.645.
The model Cumulative Distribution Function is plotted in black dotted line over the actual data function.
Because a relatively large number of trials was used (10,000) the actual data function is very close to the model distribution.
Probability density charts display the relative likelihood (Y Axis) of each random variable value (X Axis).
For continuous random variables, the Y Axis displays the probability density and the total histogram area is 1.
For discrete random variables, the Y Axis displays the probability mass at discrete X Axis values and the sum of the probability mass is 1.
In the charts below, the probability density histogram of the actual data series is displayed using blue bars.
The model probability density is plotted in the solid black line.
The data generated using latin hypercube sampling (right) has a histogram matching closely the model probability density.
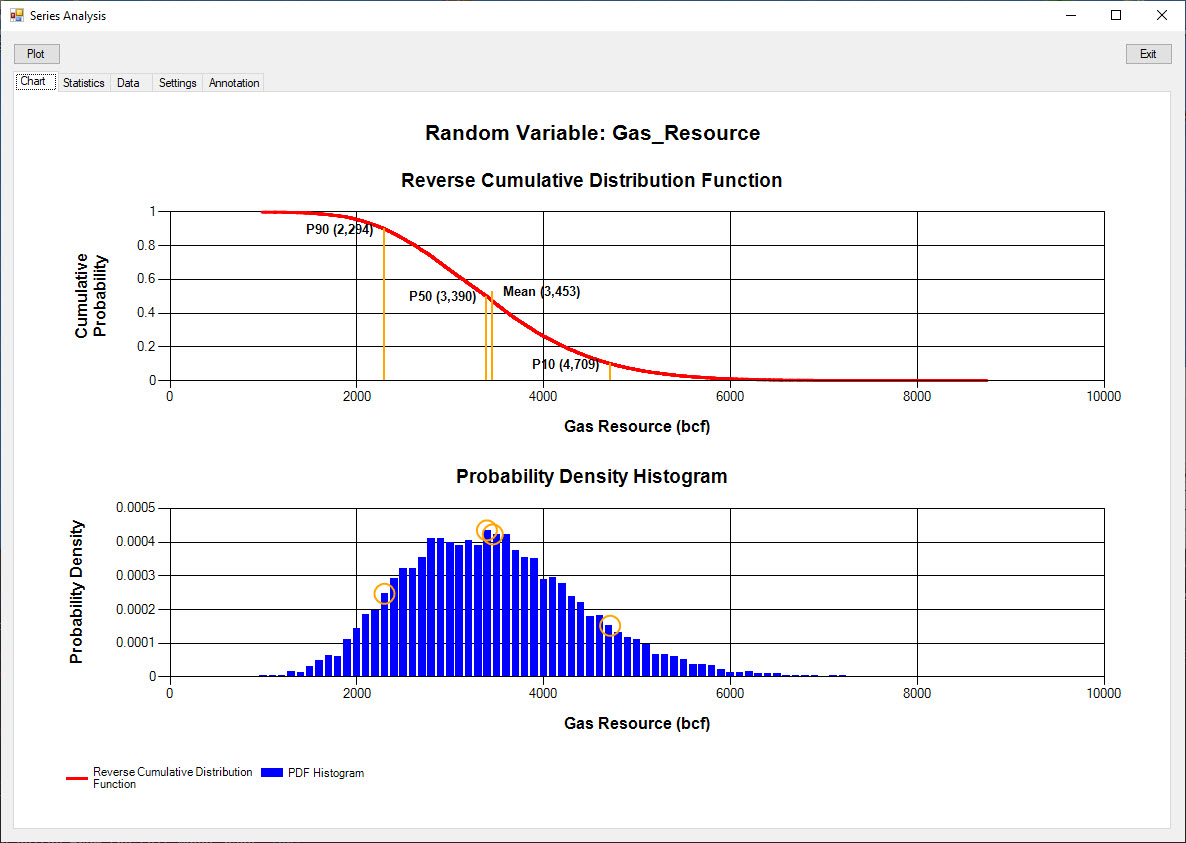
The series analysis of a calculated output value is shown below.
Model distributions cannot be easily generated for output values (hence the need for Monte Carlo simulations).
In this gas resource volume estimation, the reverse cumulative distribution function is shown.
The P90 value of 2,294 bcf (billion cubic feet) means that there is a 90% probability of at least 2,294 bcf of gas being recoverable from the gas field.
Latin hypercube sampling of the input random variables has little effect on the calculated data and noise in the probability density histogram because of the random selection of input values used in each trial calculation.